# Packages needed ####
library(shiny)
library(shinydashboard)
library(RColorBrewer)
library(tidyverse)
library(bslib)
library(bsicons)
library(shinyWidgets)
library(ggiraph)
library(viridis)
library(DT)
library(fontawesome)
library(htmltools)

# Data ####
affairs_1969 <- readr::read_csv("https://raw.githubusercontent.com/vincentarelbundock/Rdatasets/master/csv/AER/Affairs.csv") |>
  dplyr::mutate(happy = case_when(rating==1 ~ "very unhappy",
                                  rating==2 ~ "somewhat unhappy",
                                  rating==3 ~ "average",
                                  rating==4 ~ "happier than average",
                                  rating==5 ~ "very happy")) |>
  dplyr::mutate(happy = fct_reorder(happy, rating)) |>
  dplyr::mutate(cheat=factor(ifelse(affairs==0,"Faithful","Cheater")))


# Define User Interface ####
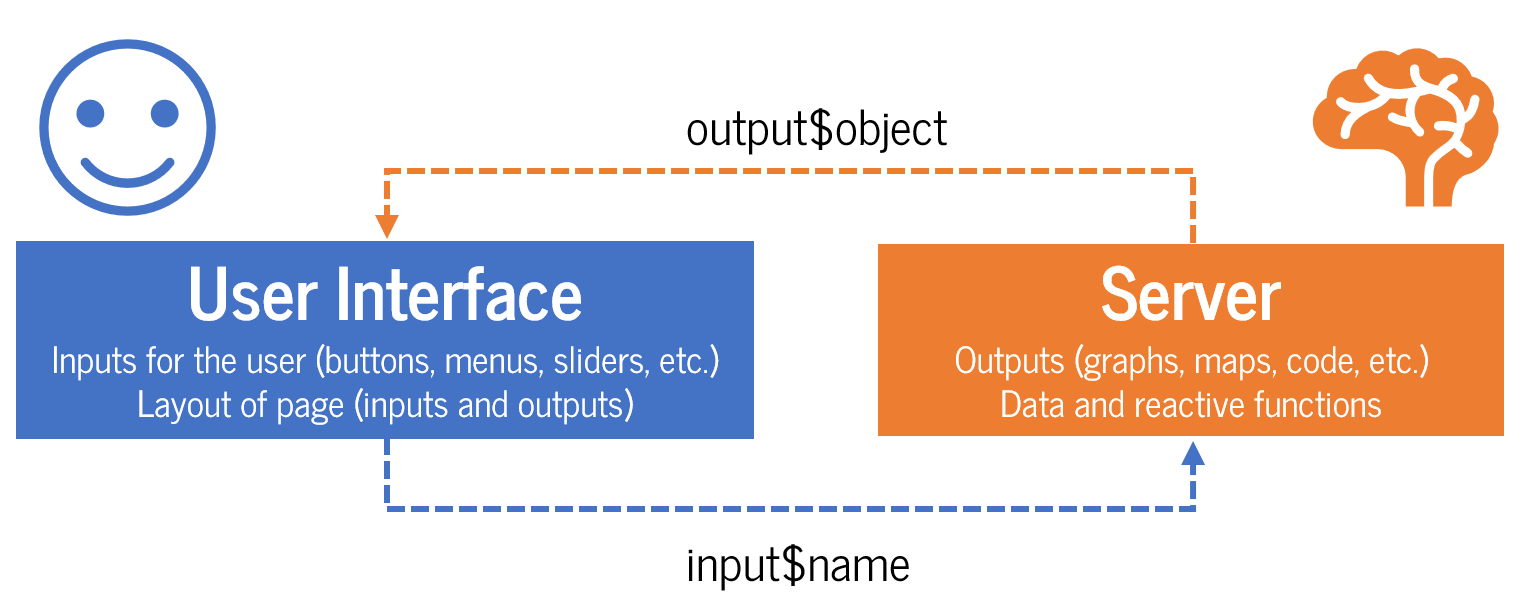
{ui_affair_alt <- page_navbar(
    # Page options ####
    title = "Fair's Affairs 1969",
    footer = "R4DEV",
    theme = bslib::bs_theme(
      bootswatch = "united",
      bg = "white",
      fg = "purple",
      success = "red",
      danger = "orange",
      base_font = "News Cycle",
      font_scale = 1.1
    ),
    # First panel ####
    tabPanel(title = "Happy cheaters?",
             icon = icon("heart-crack", lib = "font-awesome"),
             layout_column_wrap(
               width = 1/2,
               uiOutput("cheating_rate"),
               card(
                 card_header("Survey from 1969 in Psychology Today"),
                 card_body(
                   p("Was cheating more likely in unhappy marriages?"),
                   p("Were most educated couples more or less likely to have an unfaithful partner?"),
                   p("What about couples with children?")
                   )
                 )),
              layout_column_wrap(
                width=1/2,
                card(
                  full_screen = TRUE,
                  card_header(
                    selectInput(inputId = "happy",
                                label = "Select respondents by self-evaluation of marriage:",
                                choices = unique(affairs_1969$happy),
                                selected = "average")
                    ),
                  girafeOutput("affairs")
                  ),
                card(
                  full_screen = TRUE,
                  card_header("Respondents:"),
                  DT::dataTableOutput("table")
                  ))),
    # Second panel ####
    tabPanel(title = "Who cheated?",
             icon = icon("triangle-exclamation", lib = "font-awesome"),
             layout_column_wrap(
               width=1/2,
               height = "150px",
               uiOutput("cheating_children"),
               card(
                 card_header("Who cheated more frequently?"),
                 card_body(
                   shinyWidgets::switchInput(
                     inputId = "children",
                     label = "Respondent has children?",
                     value = FALSE,
                     onLabel = "Yes",
                     offLabel = "No",
                     onStatus = "success",
                     offStatus = "danger")
                   ))),
                 layout_column_wrap(
                   width = 1/2,
                   card(
                     full_screen = TRUE,
                     card_header("By years of education"),
                     card_body(
                       plotOutput("affairs_edu")
                       )),
                   card(
                     full_screen = TRUE,
                     card_header("By years of marriage"),
                     card_body(
                       plotOutput("affairs_years")
                       )))))
}

# Define the server function ####
server_affair_alt <- function(input, output) {

  # First tab ####
  ## Cheating rate value box ####
  output$cheating_rate <- renderUI({

    value_box(
      title = "Cheating rate in the sample:",
      height = "200px",
      value = affairs_1969 |>
        dplyr::count(cheat) |>
        dplyr::mutate(sample = sum(n)) |>
        dplyr::transmute(cheat_rate = scales::percent(n/sample)) |>
        dplyr::slice(1) |>
        as.character(),
      showcase = bsicons::bs_icon("heart-pulse-fill"),
      p("Infidelity varies by age, occupation, children and years of marriage"),
      full_screen = TRUE,
      theme_color = "success"
    )
  })

  ## Plot ####
  output$affairs <- renderGirafe({

    affairs_gg <- affairs_1969 |>
      dplyr::filter(happy==input$happy) |>
      dplyr::count(cheat,gender,age) |>
      ggplot(aes(x=age,
                 y=n,
                 fill=cheat,
                 data_id=age,
                 tooltip=paste0("Type: ", cheat,
                                "<br>Respondents: ", n,
                                "<br>Age: ", age)))+
      ggiraph::geom_col_interactive()+
      theme_classic()+
      facet_wrap(gender~cheat)+
      scale_fill_viridis_d("plasma")+
      theme(legend.position = "none")+
      labs(title = "Respondents by self-declared happiness, by age and gender",
           subtitle = paste("Among", input$happy, "respondents"),
           x="Respondent age",
           y="# respondents")

    ggiraph::girafe(ggobj = affairs_gg,
                    opts_selection(type = "multiple"))
  })

  ## Table ####
  output$table <- DT::renderDataTable({

   affairs_1969 |>
      dplyr::filter(happy==input$happy) %>%
      dplyr::group_by(cheat,age) |>
      dplyr::mutate(n=n()) |>
      dplyr::filter(age %in% input$affairs_selected) |>
      dplyr::ungroup() |>
      dplyr::select(affairs, age, education,children, happy, n)
  })

  # Second tab ####
  ## Value box ####
  output$cheating_children <- renderUI({

    value_box(
      title = "How many respondents who cheated had children?",
      height = "200px",
      value = affairs_1969 |>
        dplyr::filter(children=="yes") |>
        dplyr::count(cheat) |>
        dplyr::mutate(sample = sum(n)) |>
        dplyr::transmute(cheat_rate = scales::percent(n/sample)) |>
        dplyr::slice(1) |>
        as.character(),
      showcase = icon("children", lib = "font-awesome"),
      p("Cheaters with children in the sample"),
      full_screen = TRUE,
      theme_color = "danger"
    )
  })

  ## Plot by education ####
  output$affairs_edu <- renderPlot({

    if (input$children) {

      affairs_1969 %>%
        dplyr::filter(children=="yes") |>
        dplyr::count(cheat, gender, education) |>
        ggplot(aes(x=education,y=n,fill=cheat))+
        geom_col()+
        geom_label(aes(label=n), fill="black",color="white", vjust=-0.5)+
        scale_fill_brewer("Set2")+
        facet_wrap(gender~cheat)+
        theme_classic()+
        theme(legend.position = "none")+
        labs(title = paste("Among", input$happy, "respondents"),
             x="Respondent education",
             y="# respondents")
    }
    else {
      affairs_1969 %>%
        dplyr::filter(children=="no") |>
        dplyr::count(cheat, gender, education) |>
        ggplot(aes(x=education,y=n,fill=cheat))+
        geom_col()+
        geom_label(aes(label=n), fill="black",color="white", vjust=-0.5)+
        facet_wrap(gender~cheat)+
        scale_fill_viridis_d("rocket")+
        theme_classic()+
        theme(legend.position = "none")+
        labs(title = paste("Among", input$happy, "respondents"),
             x="Respondent education",
             y="# respondents")
    }
  })

  ## Plot by years of marriage ####
  output$affairs_years <- renderPlot({

    if (input$children) {

     affairs_1969 %>%
        dplyr::filter(children=="yes") |>
        dplyr::count(cheat, gender, yearsmarried) |>
        ggplot(aes(x=yearsmarried,y=n, fill=cheat))+
        geom_col()+
        geom_label(aes(label=n), fill="black",color="white", vjust=-0.5)+
        facet_wrap(gender~cheat)+
        scale_fill_brewer("Set2")+
        theme_classic()+
        theme(legend.position = "none")+
        labs(title = paste("Among", input$happy, "respondents"),
             x="Respondent years of marriage",
             y="# respondents")

    }
    else {
        affairs_1969 %>%
          dplyr::filter(children=="no") |>
          dplyr::count(cheat, gender, yearsmarried) |>
          ggplot(aes(x=yearsmarried,y=n, fill=cheat))+
          geom_col()+
          geom_label(aes(label=n), fill="black",color="white", vjust=-0.5)+
          facet_wrap(gender~cheat)+
          scale_fill_viridis_d("rocket")+
          theme_classic()+
          theme(legend.position = "none")+
          labs(title = paste("Among", input$happy, "respondents"),
             x="Respondent years of marriage",
             y="# respondents")
      }

  })

}

# Run App ####
shinyApp(ui_affair_alt, server_affair_alt)